Tuesday, October 15, 2013

National TV Rondo

The enigmatic Rondo is one of the truly unique players in NBA history. Attached to his lore is the idea that he steps up in big games and especially on nationally-shown ones. This mythic form of Rondo, mentioned here by Bill Simmons and here by a Celtics site, is one who takes over games and uses his talents to their full potential. Allegedly, he's a triple-double machine, and instead of passively probing the defense and settling for passes he attacks the basket more.

Defining the terms

The four major networks that carry NBA games nationally are TNT, ESPN, NBATV, and ABC. Which network contributes to this mythic form of Rondo is up for debate, but it's easy to split the numbers by channel and look for patterns. If Rondo performs better with a brighter spotlight, then we should see him do better in ESPN games than NBATV games, and better in ABC games than ESPN ones.

Harvardsports already did an article on the subject, but it was limited work with a few problems. First of all, it didn't control for minutes played, much less possessions. It's not unreasonable to assume Rondo will play more in nationally televised games. The data also spanned two seasons (2012 and 2013), but in combining two seasons you assume national games were evenly distributed between the two seasons, and that's not often the case with an aging team becoming less marketable.

Also, how do we judge a player getting better or worse in televised games? You can go by points per game, or per possession, sure, but that's missing playmaking, efficiency, defense, and other factors. And the all-encompassing stats aren't perfect either. This is the age of advanced stats, but there's no agreement on which player metric to use. My solution is to break down the games by a multitude of stats to look for patterns, and then to evaluate the key question using a simplified version of WARP. I ignore defense, which is hard to capture in box score stats, and I ignore offensive rebounding -- when people talk about National TV Rondo it's usually about his offense anyway, and offensive rebounds aren't particularly relevant for point guards.

As a final note, I'm looking at both regular season and playoff games but only from the 2008 season and on, so Rondo's rookie season is ignored as I don't find it especially pertinent.

The numbers

Using a variety of sources, Rondo has been in 144 nationally televised games. 34 of those were on NBATV, but a healthy 22 of those were on ABC. The rest were on ESPN and TNT.

Adjusting for pace, the numbers are posted below. OffRat is an efficiency metric based on WARP whose inputs are shooting efficiency, usage (you get credit for carrying a bigger load), assists, unassisted shots (more credit for unassisted shots), and the league average efficiency. His numbers are mostly unchanged across the board, with the exception of ABC games. Rondo scores at a significantly higher level on better efficiency. Although he turns the ball over more, he's assisting more -- and remember, this is adjusted for pace (and by extension minutes played.) An offensive rating that's 1.6 points better is a clear separation. The chart below, by the way, didn't include playoff numbers for a different perspective.


No national TV
National TV
ESPN/TNT/ABC
ABC only
PTS/100 Poss
13.7
14.0
14.3
16.9
AST/100 Poss
10.1
10.4
10.7
12.2
STL/100 Poss
2.21
2.13
2.07
1.77
TOV/100 Poss
3.27
3.23
3.30
3.43
DReb%
7.0
7.3
7.4
8.2
OReb%
4.5
4.5
4.7
5.7
TS%
50.7
52.2
51.1
52.3
OffRat
94.6
95.1
94.9
96.2
*Seasons: 2008 to 2013, playoffs included


The difference between Rondo's offensive rating in nationally televised games versus non-televised is fairly small. In fact, using a t-test there's no statistical significance, even with the ABC-only games, partly due to the smaller sample size. However, the Celtics are more likely to face a better opponent during these games, which makes Rondo's exploits more impressive. Indeed, the competition is certainly more steep in the nationally televised games -- for ABC, the average opponent is nearly at a 5 SRS, which is contender status. Roughly speaking, there are only about four such opponents every season, and the Celtics had that strength for two of them. Using an adjustment based on the "simple" defensive rating of the opponent, Rondo's numbers are magnified. His offensive rating increases by nearly two points, and for ABC games it nearly increases by four. (Remember, the scale is points produced per 100 possessions, ignoring offensive rebounds, so it's a notable leap in efficiency.)


No national TV
National TV
ESPN/TNT/ABC
ABC only
OppDef
-0.05
-1.36
-1.73
-2.31
OppSRS
-0.33
2.15
2.94
4.76
Adj. OffRat
94.8
96.6
96.7
98.4
To determine whether or not the difference is significant, a t-test is used. But again, a few tweaks are introduced. First of all, playoff games are dumped from the analysis since playoff games are more likely to be televised and the point here isn't testing playoff Rondo. Also, the Celtics were televised at different rates at various stages of Rondo's career. Seasons are grouped together based on the proportion of televised games to non-televised. If a player wasn't televised earlier in his career, for example, his stats will look better in televised games because he was a more developed player by then.

Digging into the stats, National TV Rondo doesn't appear to be a myth: his numbers are definitely better, even breaking down into multiple seasons segments and slicing up the types of televised games. From 2009 to 2010, his numbers on national TV were better but the p-value was just a smidge above 0.05, which is the normal threshold for rejection. (P-value is basically like the probability of the null hypothesis being true, where the null is there is no difference of Rondo in national games.) The division of the seasons into only two year bins pushes the p-value higher, and if you combine seasons '09 through '12 you definitely get statistical significance (the proportion of national TV games to non-national was roughly 0.65 for 09/10 and 0.75 for 11/12, so this is still an okay comparison.)


Seasons
Non-televised average
Televised average
df
p-value
All*
2009-10
95.5
97.1
137.0
0.0581
All*
2011-12
91.5
96.6
116.4
3.78e-7
ESPN/TNT/ABC
2009-10
95.5
97.1
109.2
0.0604
ESPN/TNT/ABC
2011-12
91.5
96.8
86.6
1.95e-6
ABC
2009-12
93.9
98.5
27.8
2.67e-4
*Includes NBATV, ESPN, TNT, and ABC

Conclusion

Looking at a few seasons of data, Rondo does appear to play significantly better in nationally televised games, especially when you adjust for the higher level of defense from the opponents and when you look at games on ABC, which as a network carries more weight than a game on TNT. Adjusted for pace, he scores more points on a better efficiency, and even assists more when ABC is televising. Does Rondo just play better versus a higher level of competition? Well, that was tested too as a confounding variable, but Rondo's stats did slightly get worse versus better opponents/defenses, so the fact that his numbers improve in televised games, where there's a higher level of competition, is impressive. In any case, his numbers in general fare better versus better defenses than average, and this effect is increased when the game is nationally televised. And I'm even ignoring rebounding, where it appears he holds up even against better teams.

Are there any other explanations? Even with Rondo doing well against good defenses it's still within the spirit of the original question: Rondo rises to the occasion. Top defenses could have different strategies; they may dare Rondo to shoot and leave him open, choking off the better options. But then why do his assists not plummet and in the case of his ABC games they actually increase? He's a perplexing, unique player, and in an ode to quantum physics he changes when he's being observed.

Thursday, October 10, 2013

Introducing: 1990's RAPM

Background for what RAPM is: +/- was a revolution for the NBA because it allowed a completely new method at evaluating players. You look at how a team scores and defends with you on the court and without you. When you set players as variables, you can use regression to calculate player impact. It's a full scope view of what matters in a game: outscoring your opponent. However, it's noisy for a number of reasons. One is that some player combinations are rare (this is known as collinearity.) Another is that the models don't deal well with players with low minutes, as they don't have enough of a sample for an accurate estimate and will often produce a ludicrous result just to "fit" the data better. 

In simple terms, RAPM deals with this by introducing a heavy dose of regression to the mean. While traditional adjusted +/- creates a model by minimizing error (the difference between the actual points per possession scored/allowed and the expected), RAPM also minimizes the coefficients in the model using a lambda term. The coefficients are reduced toward the "prior," which can be set as zero or as a set of prior values (like the previous season's result.) Players with few possessions/minutes will have results close to their priors because their sample size isn't big enough to prove to the model they're more or less valuable.

After some major work, I'm finally ready to display the '97 RAPM numbers. Given the nature of the data source, where only last names are used, making it tricky to figure out who's on the court for teams with players who share last names, it's been a labor intensive process. There are also a number of random errors that crop up. Regardless, the work has been fruitful, and I'll work on the seasons following 1997 when I can. The results are shown below.

*When you reference the spreadsheet, try to include the version number. This will reduce future discrepancies.

Back in the earlier days of the stat movement, there was something called the laugh test: if Shaq was not the top ranked player, something was wrong with your metric. Since this is the 90's, this is the Jordan test. I was relieved to find Michael Jordan near the top of the leaderboard, as well as other stars like MVP Malone third. But Christian Laettner and Terry Mills? Well, first of all non-prior informed RAPM often produces wacky results. For example, the fourth through sixth ranked players in the 2002 list (non-prior informed) from the popular RAPM site stats-for-the-nba.com were Eduardo Najera, Devean George, and Ryan Bowen. Laettner played every game for the Hawks, who were one of the best defensive teams in the league: so perhaps without a missed game there wasn't enough data to show his "true" defensive value.

Nevertheless, credit should be given to him and the forgotten Terry Mills, a beefy three-point shooting power forward. He was a bench player on a good team yet had the 12th best net +/- rating, according to stats.NBA.com. Putting up a great raw +/- can come by accident by hitching yourself to better players, only playing when they do; but he came off the bench for a playoff team and has a raw rating nearly two times as great as anyone else on the team. There's something to be said about Terry Mills' value in '97.

Another surprising result was Bo Outlaw's outstanding defensive +/-. It was the best rating a hair ahead of DPOTY Mutombo (retroactively justified here) with defensive legends Mourning and Ewing not too far behind. Even at 21 years-old, Garnett shines once again in +/-, just as he did 16 years later in the 2013 season. As for offense, Jordan, Pippen and Mookie Blaylock, and of course Terry Mills, are near the top, but MVP Malone takes the mantle. As for an underrated player RAPM likes, Hornacek is a close sixth. The sweet-shooting guard had one of the best jump shots in the game and could pass well for an outside shooter. He's also one of the most accepting of advanced stats for former players and coaches.

In the future, I'll work on the 1998 season, as well as creating a statistical +/- prior to test out for this season and other fun items. (Since play-by-play data is unavailable before '97, the results using pure +/- are limiting. Thus, a model that creates priors for every player should provide more reliable results, instead of blindly regressing every player toward 0. Players who only play around 50 minutes will be rated as 0's in RAPM, even though they're probably a lot worse, and the model shouldn't assume the prior for a guy like Michael Jordan is 0.)

Click here for the link to the spreadsheet.

Edit: On updating the possession/lineup parser and adding missing games, some of the values here changed. 

Tuesday, October 8, 2013

The Defensive Anchors and Where to Find Them

My home team the Blazers have some promising talent and an all-star power forward, but they're missing a key factor: defense, particularly in the middle. Getting rid of Hickson is a start, but Robin Lopez is more of a placeholder and a backup than a solution, and I'm not sure Meyers Leonard will turn into an elite defender. I've dreamt about schemes to bring up the kind of talent the Blazers need to completely upgrade their defense, but it appears finding elite anchor talent in the middle isn't as difficult as it seems. It's not easy, sure, but it doesn't take the wealth of a royal family and a bundle of young assets. Defensive anchors have been found everywhere in the draft.

xRAPM: (points per 100 defensive possessions where 0 is "average")
Note: this is a hybrid model based on a box score stats model and plus/minus stats.
RAPM (points per 100 defensive possessions where 0 is "average")
Note: this model is only plus/minus stats.
Synergy (total points per possessions allowed)
Block% (percentage of opponent two point field goals blocked)
DReb (percentage of rebounds grabbed on defense)
Team DRtg  (in: team points allowed per 100 possessions with the player) 
Team DRtg  (out: team points allowed per 100 possessions without the player) 
Height is without shoes unless otherwise noted. Generally listed player height is roughly an inch of inflation.

Veterans with one foot in the grave

Kevin Garnett:

Garnett's intensity and floor leadership sets him apart, and he continues to destroy the metrics despite his age. He's been a plus/minus king for over a decade. He's the old master of defending the pick and roll. His minutes will be limited, and we should await for the inevitable fall, but his work ethic and personality will extend his elite defense for even longer.


xRAPM: 5.9
RAPM: 4.7
Synergy: 0.76
Block%: 2.4
DReb: 25.8
Team DRtg  (in): 99.3
Team DRtg (out): 108.3
Height: 6' 11"
Wingspan: N/A
Standing reach: N/A
Draft slot/acquired: fifth pick in '95. Acquired by Celtics in a massive trade. Then by Nets so the Celtics could shed veteran salaries and rebuild.


Tim Duncan: 

Duncan was rejuvenated. He set career highs in blocks per possession and DReb rate. Some of his advanced stats aren't extraordinary, but his prime was ten years ago. He's the archetype of what a team craves from a number one pick: an all-time defensive big man, and consistent with great character.


xRAPM: 6.3
RAPM: 4.2
Synergy: 0.88
Block%: 6.4
DReb: 29.6
Team DRtg  (in): 99.4
Team DRtg (out): 103.6
Height: 6' 11"* (unofficial)
Wingspan: N/A
Standing reach: N/A
Draft slot/acquired: first pick in '98.


Young(ish) defensive anchors

Larry Sanders:

With super long arms, energy, and sass, Larry "Hey now!" Sanders is a defensive anchor who came out of nowhere. After two disappointing years where he couldn't even make an easy basket (sub-47 TS%), he broke out at age 24, erasing the many mistakes of his teammates and conjuring hope to other athletic and rangy project big men.


xRAPM: 6.1
RAPM: 3.2
Synergy: 0.84
Block%: 7.6
DReb: 25.8
Team DRtg  (in): 102.4
Team DRtg (out): 108.3
Height: 6' 10"* (with shoes)
Wingspan: 7' 6.5"
Standing reach: N/A
Draft slot/acquired: 15th pick in '10.


Omer Asik:

After two years under the Thibodeau Bulls, where despite backing up Noah the team played better defense when Omer was on the court, he proved his startling defensive numbers were valid. When he was on the court for Houston, they defended nearly as well as the champion Miami Heat and were in spitting distance of the Bulls. With size, quick feet, and a relentless motor, he held down the paint for a team without many defensive weapons.


xRAPM: 5.4
RAPM: 2.9
Synergy: 0.87
Block%: 2.7
DReb: 31.0
Team DRtg  (in): 104.2
Team DRtg (out): 110.0
Height: 7' 0"* (listed height)
Wingspan: N/A
Standing reach: N/A
Draft slot/acquired: 36th pick, second round '08, by the Blazers. Traded on day of the draft of the Bulls. Later signed using a poison-pill contract by the Rockets.


Roy Hibbert:

After an exciting post-season series versus the Heat, Roy Hibbert is probably overrated, which isn't the worst position after a shooting slump in the first half of the season caused many fans to declare him a bust. He's probably the tallest starter in the league, and he uses his huge frame to wall off the paint by keeping his hands raised high, not going for the foul, and daring the opponent to shoot over him. However, he's not the quickest guy and doesn't rebound well on defense, which explains why some of his defensive metrics are underwhelming.


xRAPM: 4.3
RAPM: 1.1
Synergy: 0.86
Block%: 6.7
DReb: 17.4
Team DRtg  (in): 98.8
Team DRtg (out): 101.4
Height: 7' 2"* (listed height)
Wingspan: N/A
Standing reach: N/A
Draft slot/acquired: 17th pick '08 by Toronto. Soon traded to the Pacers as a part of Jermaine O'Neal's multi-player deal.


Joakim Noah:

The combination of Noah's ADHD, energetic defense and Thibodeau's propensity to run players into the guard may result in the first NBA coaching homicide, but until that happens, and while he's healthy, Noah will remain an anchor. SportVU, which uses cameras to track player movements, found that Noah averaged the longest distance ran per game ... at 2.74 miles (though not every team was covered by SporsVU.) The Bulls have a real offense again, and they should have another successful season buoyed by their defense, thanks in large part to this goofball.


xRAPM: 4.9
RAPM: 0.5
Synergy: 0.81
Block%: 4.4
DReb: 22.6
Team DRtg  (in): 101.2
Team DRtg (out): 106.3
Height: 6' 10.5"
Wingspan: 7' 1.25"
Standing reach: 8' 10.5"
Draft slot/acquired: ninth in '09.


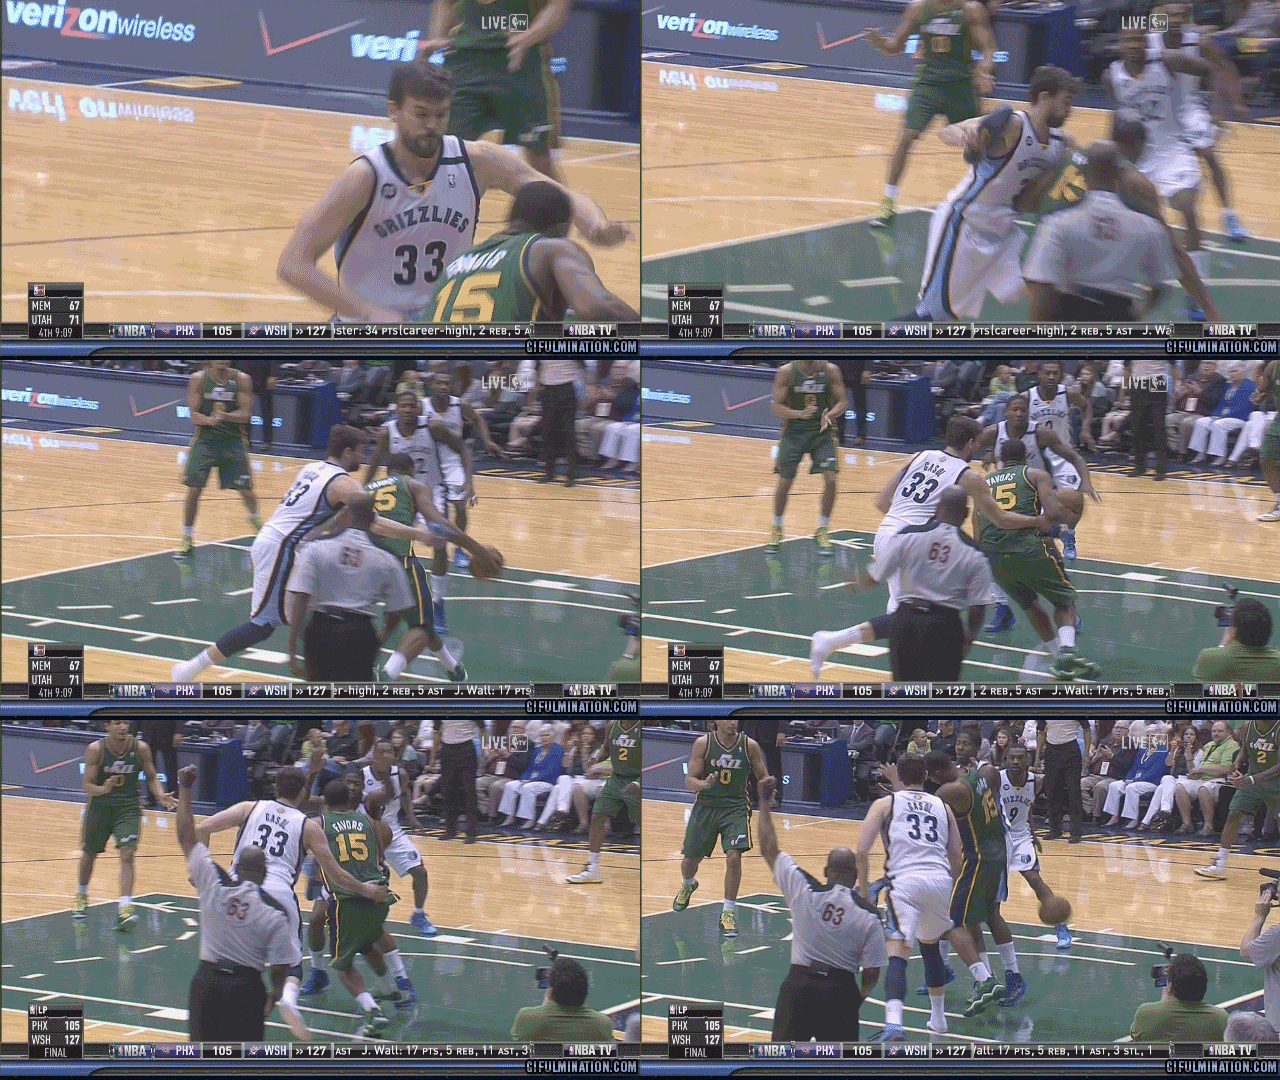
Marc Gasol:

In a tight DPOTY-race, Marc Gasol took home the trophy, partly because he was able to play big minutes to an elite defensive squad. He's a huge, intelligent defender, and besides his rebounding his numbers are off the charts. And think about this: the Grizzlies basically tied the Pacers for best defense, adjusting for strength of schedule, and the other interior big man was Zach Randolph, boosted by a bench that included no defensive help. Marc deserved the award.

xRAPM: 5.6
RAPM: 3.9
Synergy: 0.76
Block%: 4.1
DReb: 18.9
Team DRtg  (in): 98.2
Team DRtg (out): 105.1
Height: 7' 1"* (with shoes)
Wingspan: N/A
Standing reach: N/A
Draft slot/acquired: 48th, second round '07 by the Lakers. Traded in infamous Pau Gasol deal before he stepped onto the court.


Class of his own

Dwight Howard:

Seen below in a 1970's style woman's jacket, Howard is the most polarizing player in the league, and is coming off a disastrous season in LA. Even in a down year his numbers were marvellous: contrary to popular belief, it's hard to score on him in the post, and he remained an elite rim protector who rebounded at a high rate. With his age, fitness level, and long arms, he has a good chance at regaining his defensive prime, which wasn't as far away as most thought last season. As a former number one pick who has held the mantle of best center for years bringing in a circus of drama to Houston, he's in a class of his own, for better or worse.


xRAPM: 6.3
RAPM: 3.3
Synergy: 0.74
Block%: 4.9
DReb: 27.4
Team DRtg  (in): 105.5
Team DRtg (out): 110.5
Height: 6' 9"
Wingspan: 7' 4.5"
Standing reach: 9' 3.5"
Draft slot/acquired: first '04. Traded to the Lakers. Then signed as a free agent by the Rockets during a frenzied period.


Thanks for applying but I've gone in another direction

Tyson Chandler:

The 2012 DPOTY dropped off rather precipitously, lending credence to Dallas' fear of his injuries. He remained an effective defensive player, but his play worsened as the season wore on. RAPM puts a lot of stock in the previous season's number, but it was clear he's heading in the wrong direction. He'll have to prove his status as a defensive anchor again this season.


xRAPM: 4.4
RAPM: 1.8
Synergy: 0.81
Block%: 3.0
DReb: 24.3
Team DRtg  (in): 106.9
Team DRtg (out): 106.7
Height: 6' 11.5"
Wingspan: 7' 3"
Standing reach: 9' 2"
Draft slot/acquired: second '01 by the Bulls. Later traded to the Hornets. Then to the Bobcats. Then to the Mavericks. Finally, he was signed as a free agent with the Knicks. Was traded for mediocre players and injury scares kept the Mavs from resigning him.


Serge Ibaka:

Although this article is virtually only about centers, I had to mention Ibaka, King of the Blocks. Although his blocks came down from a historic level, behind only Manute Bol, his defense actually improved -- but it's still not enough to be a legitimate anchor. Blocking shots can be valuable, but you have to contribute to the other shots on the floor.


xRAPM: 3.5
RAPM: 1.4
Synergy: 0.89
Block%: 7.4
DReb: 17.0
Team DRtg  (in): 102.3
Team DRtg (out): 102.8
Height: 6' 10" (listed height)
Wingspan: N/A
Standing reach: N/A
Draft slot/acquired: 24th '08.


DeAndre Jordan:

DeAndre has the physical tools of a world-class defender, but his head has yet to catch up with his body. With Doc Rivers as coach, perhaps he can take the leap, as the last time a great defensive coach replaced Vinny Del Negro the Bulls as we know them were created. And he'll need to be -- his backups are Byron Mullens and Ryan Hollins. Unfortunately, last season the Clippers were vastly better with him on the bench (mostly due to the Bledsoe/Barnes duo, as well as Turiaf, but it's a bad sign indeed.)

xRAPM: 3.1
RAPM: 0.0
Synergy: 0.86
Block%: 4.7
DReb: 22.4
Team DRtg  (in): 107.7
Team DRtg (out): 101.3
Height: 6' 9.5"
Wingspan: 7' 6"
Standing reach: 9' 5.5"
Draft slot/acquired: 35th, second round '08.


Taj Gibson:

Taj is perhaps the most underrated defensive player in the league. Backing up Carlos Boozer will make you look better by comparison, but when he's on the court their defense is truly terrifying: the team's DRtg with him on the court in 2012 was a mind-blowing 91.8. That would have broken the modern record if it had been held for an entire season. Taj is a smart, strong defender with long arms (all the trademarks of an anchor.) If he receives more playing time he deserves the proper acknowledgements for his value.

xRAPM: 2.6
RAPM: 5.0
Synergy: 0.76
Block%: 4.7
DReb: 17.5
Team DRtg  (on): 100.9
Team DRtg (off): 104.5
Height: 6' 8.5"
Wingspan: 7' 4"
Standing reach: 9' 1"
Draft slot/acquired: 26th '09.


If you've been paying attention, you'll note that besides the ancient hall of fame former power forwards and the chaotic storm of Dwight Howard, defensive anchors have been found everywhere in the draft. Besides the three aforementioned players and Tyson Chandler, who may have seen his best days behind him, Noah had the highest draft spot: ninth. In fact, out of the young defensive anchors list, the average draft spot was 25th, and including three young candidates at the end of the list it's bumped up even further to 26th.

Marc Gasol was called Pau's fat younger brother when he was a draft prospect. Few people knew or cared about guys like Larry Sanders. Ibaka was a question mark out of the Congo. And even further people knew about Asik. Perhaps the market inefficiency right now is defensive big men. It's hard enough to get people to understand who's great defensively in the NBA, much less who has the potential in college or overseas. People have been bullish on project centers with crazy long arms but don't look the part of a polished offensive player. In many cases, this has been the correct course, but whoever can find these defensive players hidden in the draft has a major advantage: you can hold down one end of the court and protect the paint with a draft pick that doesn't even need to be in the lottery. With all the increased data available and intense scouting, it's remarkable these gems can still be found. Yet there they are -- there it is.

There's hope.

Wednesday, September 25, 2013

Dunk Leaders for 1996-97

This is just a data dump as I continue to work on my big project. I haven't been posting a lot lately because I've been trying to corral the 1997 play-by-play data. Right now I'm working out the kinks, but I'm close to the finish line.

The play-by-play data isn't entirely detailed, but the advantage is that you can compile non-traditional stats like dunks. There are actually three categories of dunks: dunk, slam dunk, and driving dunk. I'm not clear on what the distinction is between dunk and slam dunk (one is more powerful ... ?), but a driving dunk is distinct and more highlight worthy than a simple and open two-hand dunk under the basket. I imagine when people check these dunk lists they're thinking of the high-flyers, not big men who live near the rim.

Without further ado, the top dunkers list of 1996-97:
Rank
Name
Made dunks
Attempted dunks
Dunk %
Dunks/
40 mins
1
Chris Webber
177
182
97.3
2.52
2
Shawn Kemp
166
181
91.7
2.41
3
Shaquille O'Neal
157
161
97.5
3.24
4
Dikembo Mutombo
146
151
96.7
1.96
5
Alonzo Mourning
131
134
97.8
2.26
6
Marcus Camby
127
142
89.4
2.68
7
Otis Thorpe
125
135
92.6
1.88
8
Rasheed Wallace
118
132
89.4
2.49
9
Jerry Stackhouse
115
118
97.4
1.45
10
Antonio McDyess
115
135
85.2
1.79
11
Dale Davis
114
117
97.4
1.71
12
Vin Baker
109
112
97.3
1.38
13
Kevin Garnett
98
105
93.3
1.31
14
Rony Seikaly
90
95
94.7
1.38
15
Patrick Ewing
87
87
100.0
1.21
*The data only counts the regular season

It's surprising to see Webber number one, given that his game seems more ground-bound, but a lot of that is a clouded perception from his post-injury seasons of the mid-00's. Shaq and Kemp are two worthy dunks, and the rest of the list is packed with big men. But I'd give the undisputed top total dunker title to Shaq for his absurd dunks per minute. No one else was close (there were a few guys in the 2 to 2.5 range in dunks per 40 mins not listed.)  Shaq also completed a high percentage of his dunks, and only ranks third in total dunks because of significant missed time.

Top dunkers ranked by total driving dunks:
Rank
Name
Made dunks
Attempted dunks
Driving dunk /tot. dunks
Dunks/
40 mins
1
Chris Webber
33
33
18.6
0.47
2
Grant Hill
24
24
35.3
0.31
3
Glen Rice
24
24
28.9
0.29
4
Antoine Walker
23
24
29.9
0.31
5
Juwan Howard
21
21
27.6
0.25
6
Jerry Stackhouse
21
21
18.3
0.27
7
Vlade Divac
20
20
34.5
0.28
8
Rodney Rogers
20
20
29.9
0.32
9
Marcus Camby
19
19
15.0
0.40
10
Shareef Abdur-Rahim
19
20
22.4
0.27
11
Doug Christie
18
18
31.6
0.23
12
Bo Outlaw
17
17
22.7
0.31
13
Patrick Ewing
14
14
16.1
0.19
14
Mario Elie
13
14
33.3
0.19
15
Derrick Coleman
13
13
18.1
0.25

This is for driving dunks, which are distinct from the other two types (dunk and slam dunk.)  Webber is the clear winner here. In the 90's, he was sensational in transition, and he probably got a lot of these dunks starting from the high post where he logged a lot of time. He even beats everyone with dunks per minute, and no highflying guard is close. Oddly enough, the seven-foot Divac also has a lot of driving dunks, but like Webber I imagine a lot of those originate from high post plays. And Camby ranking so high, especially on dunks per minute, suggests that centers who can handle the ball dunk a lot in traffic (not exactly the most amazing discovery in basketball, however.)

And where's Jordan? He's ranked near 60th and he had 10 driving dunks with 49 total, despite 3106 minutes. It's good for a guard, but guys like Christie and Gary Trent are in his range. Second threepeat played closer to the ground and used his midrange game to punish opponents. NBA.com lists him with 1202 midrange shots at an elite 48.9 conversion percentage -- I didn't check, but that appears to be the highest volume of midrange shots in the database (at least that I've seen, and that includes guys like Kobe and Dirk.) Dunks are fun to talk about, but obviously there's more to the game.

And for fun, here's a list of all players without a dunk and at least 1000 minutes played:
Name
Minutes
Height
Mahmoud Abdul-Rauf
2131
6’ 1”
Kenny Anderson
3081
6’ 0”
Greg Anthony
1863
6’ 0”
B.J. Armstrong
1020
6’ 2”
Travis Best
2064
5’ 11”
Muggsy Bogues
1880
5’ 3”
Chris Childs
2076
6’ 3”
Marty Conlon
1614
6’ 10”
Vinny Del Negro
2243
6’ 4”
Sherman Douglas
2316
6’ 0”
Joe Dumars
2923
6’ 3”
Howard Eisley
1083
6’ 2”
Anthony Goldwire
1188
6’ 1”
Tim Hardaway
3136
6’ 0”
Jeff Hornacek
2592
6’ 3”
Jaren Jackson
1133
6’ 4”
Mark Jackson
3054
6’ 1”
Steve Kerr
1861
6’ 3”
Matt Maloney
2386
6’ 3”
Darrick Martin
1820
5’ 11”
Elliot Perry
1595
6’ 0”
Ricky Pierce
1250
6’ 4”
Terry Porter
1568
6’ 3”
Mark Price
1876
6’ 0”
Khalid Reeves
1432
6’ 3”
Pooh Richardson
1065
6’ 1”
Brian Shaw*
1867
6’ 6”
John Stockton
2896
6’ 1”
Damon Stoudamire
3311
5’ 10”
Brooks Thompson
1055
6’ 4”
Rex Walters
1041
6’ 4”
Charlie Ward
1763
6’ 2”
Chris Whitney
1117
6’ 0”
*One attempted dunk